Prescott Average Temperatures & Weather
Average High and Low Temperatures
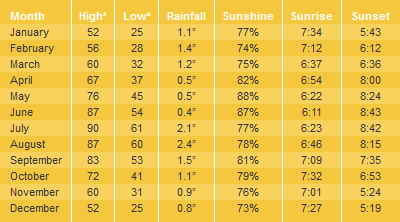
To help plan the right time to your visit Prescott, Arizona, this chart shows the average high and low daily temperatures for each month of the year including January, February, March, April, May, June, July, August, September, October, November, and December of each year. It also shows average rainfall, sunrise times, and sunset times.


In The Pines Around Prescott
Prescott Arizona
Map & Directions
Prescott Arizona
Average Temperatures
About Prescott AZ
Prescott Pictures
Jerome Area Map
Jerome Arizona
Lakes Nearby Prescott
Watson Lake
Goldwater Lake
Lynx Lake
Willow Lake
Things To Do
Camping In Prescott
Prescott Lakes
Prescott Attractions
Prescott Golf Courses
Prescott Hiking
Horseback Riding
Prescott Museums
Nearby Camping
White Spar Campground
Lynx Lake Campground
Granite Group Camping
Hilltop Campground
Yavapai Campground
Lower Wolf Creek
Upper Wolf Creek
Where To Stay
Prescott Cabin Rentals
Bed & Breakfast
Prescott RV Parks
Prescott Articles
History Lives In Prescott
Whiskey Row


